Data & Science — Data visualization · Strategic planning · Carbon neutrality
Sustainability Strategy Design
A methodology for turning fragmented institutional data into actionable climate roadmaps
Context
In 2021 I co-founded Realiza, a sustainability consultancy in Chile. The methodology at its core was one I had been developing since my time at the UC Sustainability Directorate — a repeatable process for helping organizations understand where they stand environmentally and build credible, actionable roadmaps toward carbon neutrality and sustainability certifications.
The problem this work addresses is deceptively hard: large institutions have fragmented data. Energy consumption lives in facilities. Waste data lives in operations. Commuting data does not exist until you build a survey. Biodiversity data has never been collected at all. The first challenge is always creating data pipelines thinking about the institutional context.
Technical Detail
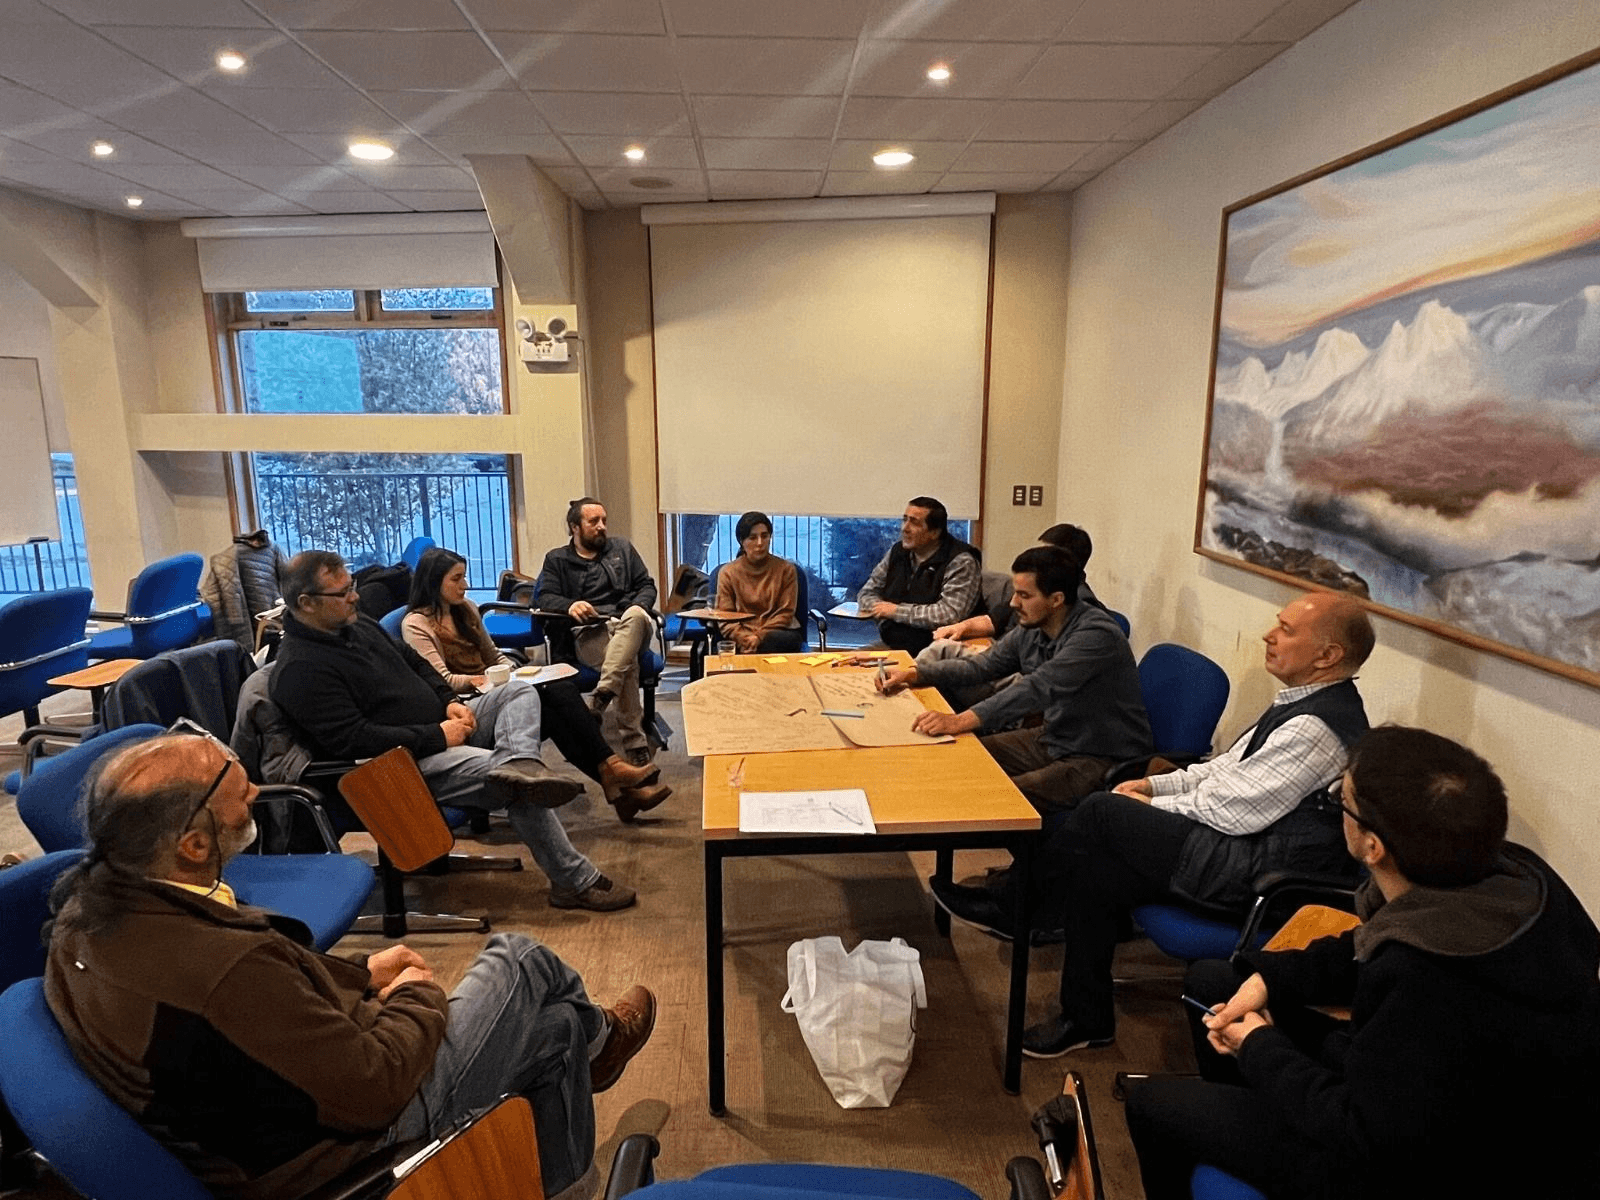
- —Data collection: custom survey instruments for commuting, waste, and energy. Qualitative workshops using participatory methodologies (Art of Hosting, Theory U) to surface institutional priorities and identify data owners.
- —Frameworks applied: GHG Protocol (Scopes 1, 2, 3), SBTi targets, GreenMetric. SDG alignment analysis using Python and SQL when needed.
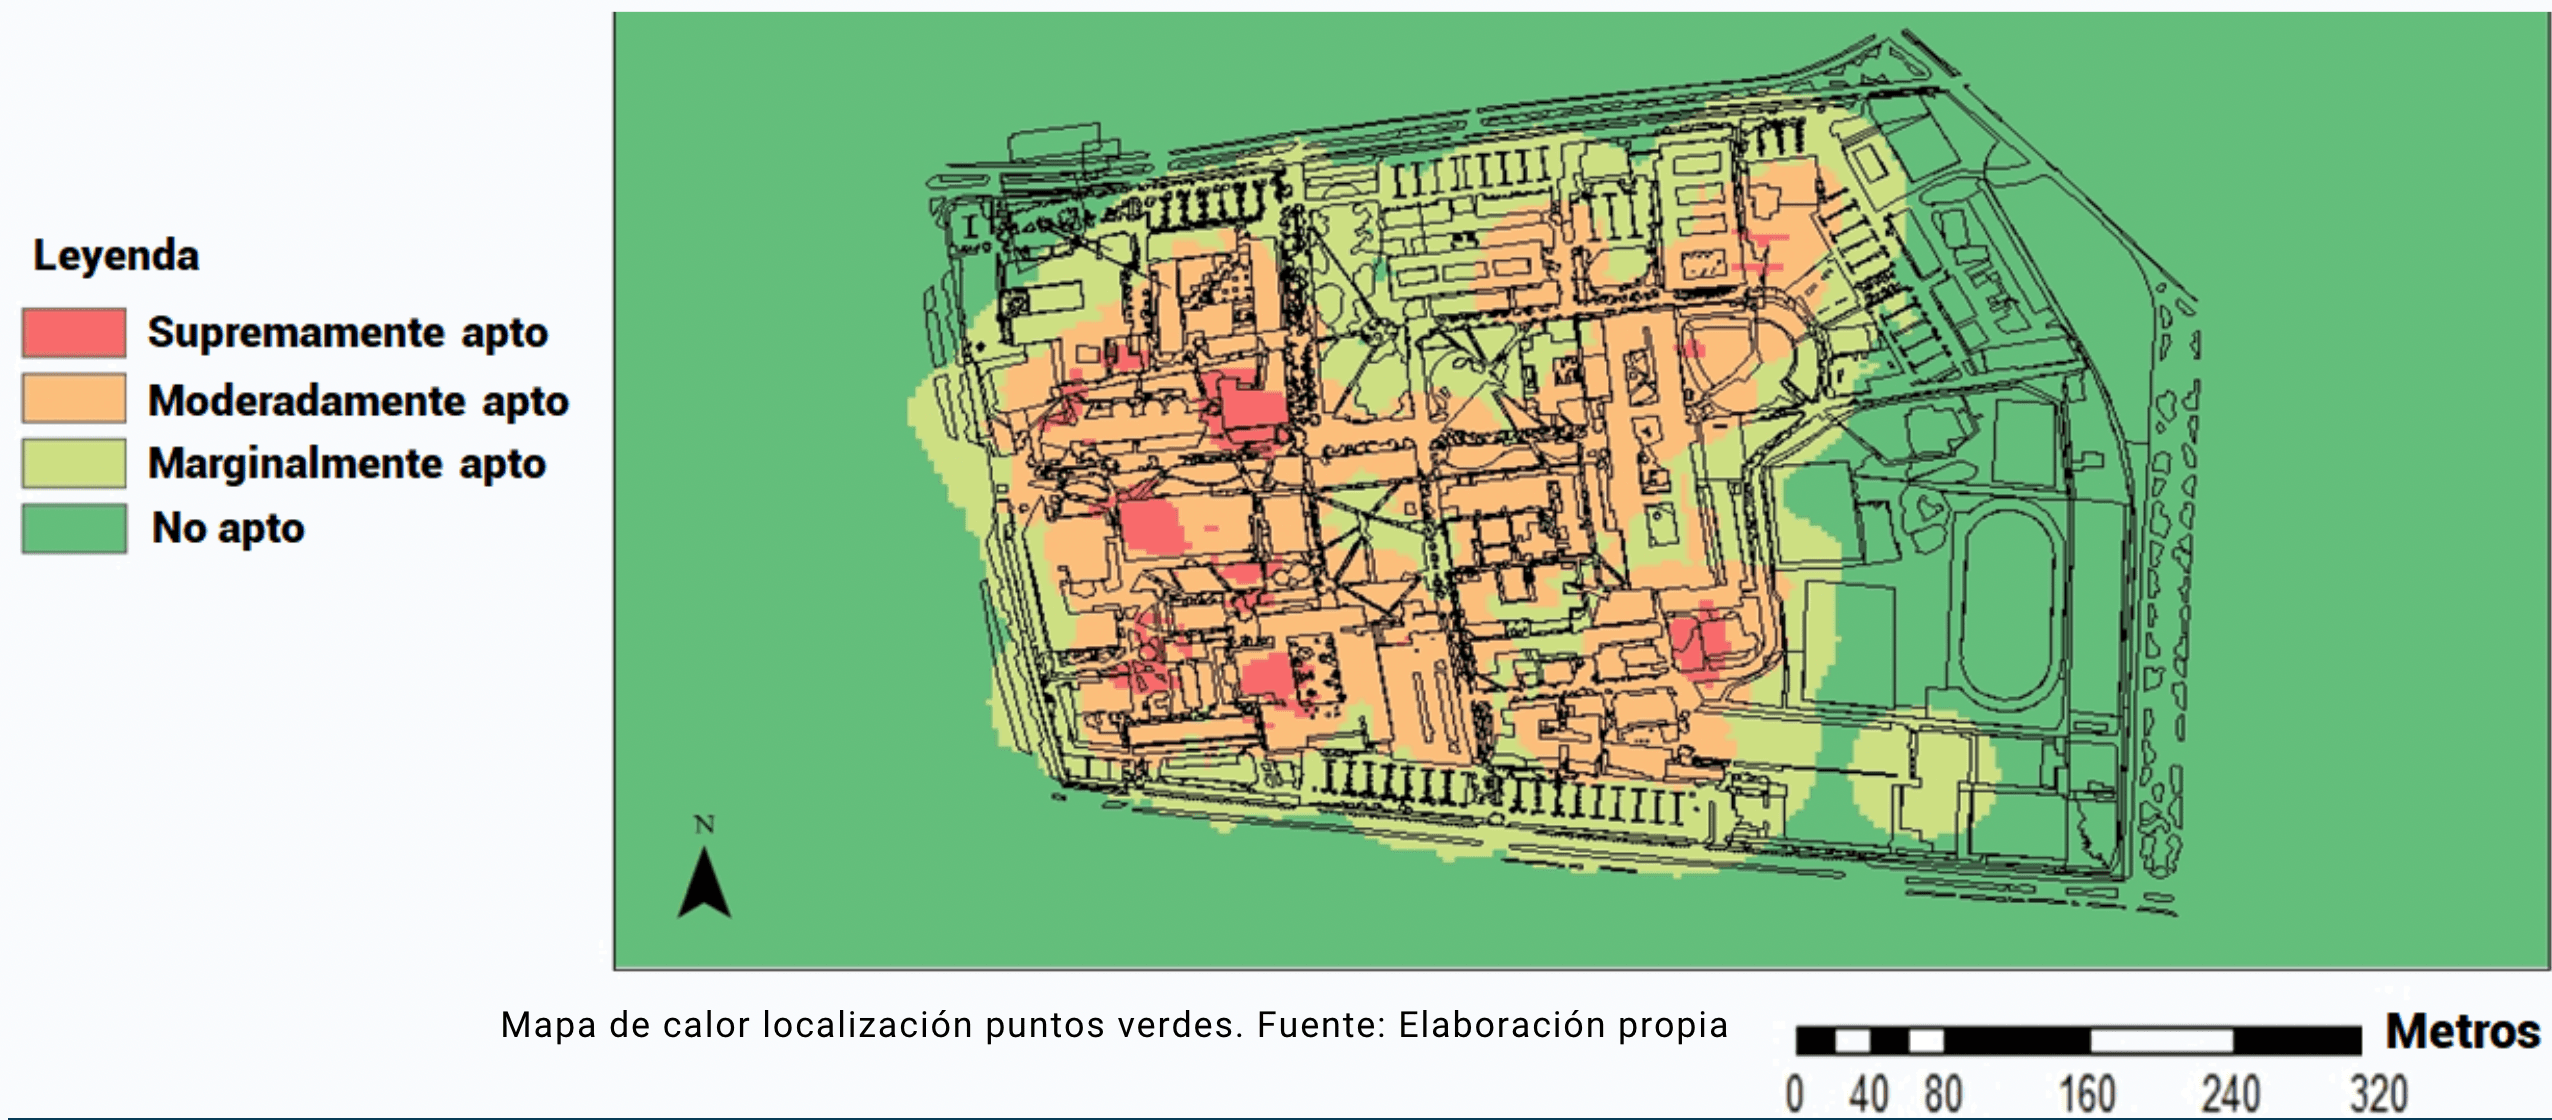
- —Data processing and visualization: Python, SQL or other tools for dataset construction, cleaning, and cross-institutional comparison. Custom dashboards in Google Looker designed to communicate to non-technical institutional leadership.
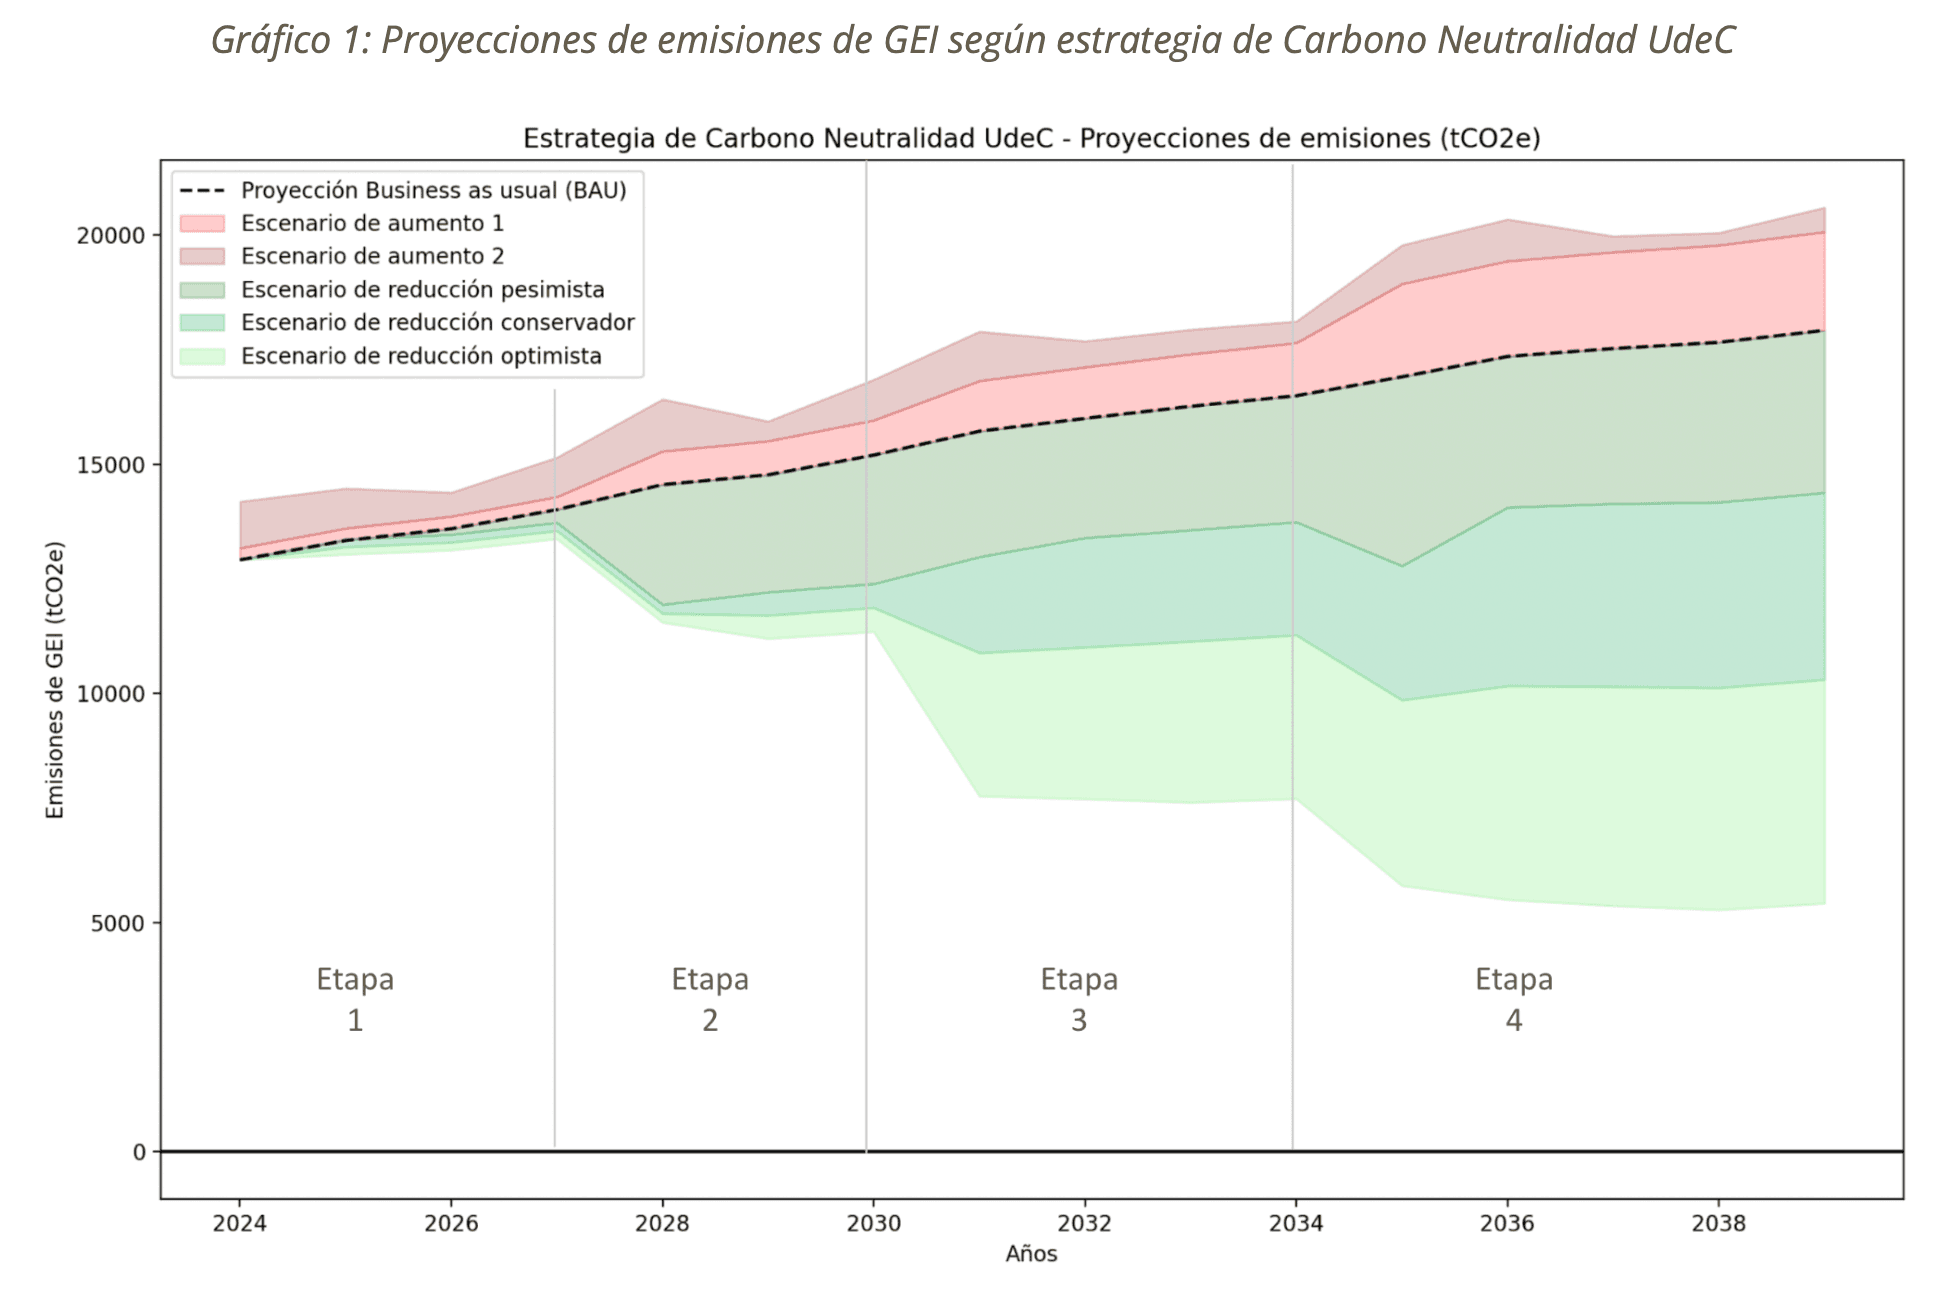
- —Decision modeling: Analytic Hierarchy Process (AHP) for project prioritization under multiple criteria. Monte Carlo simulation for emissions forecasting under uncertainty, producing future projection models with uncertainty ranges.
- —Scale: 50+ projects executed through Realiza. Clients include Universidad de Aysén, Pontificia Universidad Católica de Chile, and AJE Group's Bio Amayu agricultural supply chain (SBTi goals).
Learnings
- —The hardest part of sustainability data work is not the analysis — it is connecting climate goals to the core business and governance. Who owns the data? Who has to change their behavior to collect it? These are political and relational questions as much as technical ones.
- —Visualizing for institutional decision-makers requires stripping out almost everything. A chart that works for a researcher does not work for a university president
- —Building a consultancy around a methodology forces you to make the implicit explicit — every assumption you hold as an expert has to become a documented step that someone else can follow. Creating a system that can be replicated was the hardest part.
- —At the beginning, the core motivation was to contribute to climate action. Over time, I learned that when working with companies, impact alone is not enough — the work must also align with business profitability. This shifted my perspective toward identifying where sustainability efforts can generate tangible value for organizations, while still producing meaningful environmental impact.
